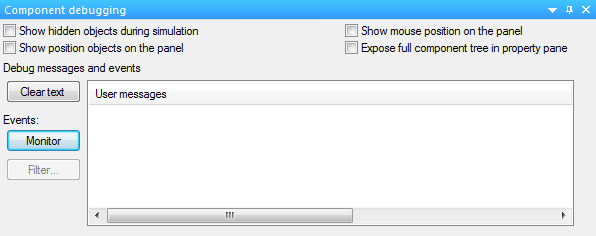
Component Debugger
The Component Debugger is used for tracking, monitoring and developing components, it displays API functions such as timers, events, macro calls such as Component Macros and Simulation Macros and much more. It can easily track button presses, switch triggers, as well as component properties and the function process.
The Component Debugger is invaluable for testing and developing components as it allows you to accurately keep track of the process of the component and allows you to enhance the functionality of the component in development with the helpful information to troubleshoot problems and errors as well as the ability to evaluate the component by watching and monitoring the process and functions of the component.
The Component Debugger also offers various useful options to extend the information you can gather to test a component. Information such as a detailed component tree shown in the Properties Panel as well as mouse position, object position and the ability to show hidden objects on the Dashboard Panel and System Panel can be used to identify any graphical, simulation and functionality issues to find areas to improve upon with the help of this additional information.
The position of components and objects are very useful to see in simulation, it allows you to accurately test accurate movement and animation as well as collision detection and input devices such as switches, buttons and dials etc.
There are simulation functions available to print text onto the 'Component Debugger' to diagnose and identify errors by allowing a trace to be printed during events, this ensures that the program is running correctly and that the flowchart logic is sound.
See the API Debug section for further technical information, including an example of the functions in use, you can download the Flowcode file by clicking on the file name on the following link:
