|
|
| (21 intermediate revisions by 2 users not shown) |
| Line 16: |
Line 16: |
|
| |
|
| ==Detailed description== | | ==Detailed description== |
| | |
| | |
| | |
| | |
| | |
| | |
| | |
| | |
| | |
| | |
| | |
| | |
| | |
| | |
| | |
| | |
| | |
| | |
| | |
| | |
| | |
| | |
|
| |
|
| ''No detailed description exists yet for this component'' | | ''No detailed description exists yet for this component'' |
|
| |
|
| ==Examples== | | ==Examples== |
| | |
| | |
| | |
| | |
| | |
| | |
| | |
| | |
| | |
| | |
| | |
| | |
| | |
| | |
| | |
| | |
| | |
| | |
| | |
| | |
| | |
| | |
|
| |
|
|
| |
|
| Line 47: |
Line 91: |
| * If Show Border is enabled then Width and Height should be as above plus 2 to account for the border pixels | | * If Show Border is enabled then Width and Height should be as above plus 2 to account for the border pixels |
|
| |
|
| ==Downloadable macro reference==
| |
|
| |
|
| {| class="wikitable" style="width:60%; background-color:#FFFFFF;"
| |
| |-
| |
| | width="10%" align="center" style="background-color:#D8C9D8;" align="center" | [[File:Fc9-comp-macro.png]]
| |
| | width="90%" style="background-color:#D8C9D8; color:#4B008D;" | '''ExportToCSV'''
| |
| |-
| |
| | colspan="2" | Exports the data in the graph to a CSV file.
| |
| |-
| |
| |-
| |
| | width="10%" align="center" | [[File:Fc9-string-icon.png]] - STRING
| |
| | width="90%" | Filename
| |
| |-
| |
| | colspan="2" |
| |
| |-
| |
| | width="10%" align="center" | [[File:]] -
| |
| | width="90%" | Erase
| |
| |-
| |
| | colspan="2" | 0=Append to the end of existing data, 1=Erase any existing data
| |
| |-
| |
| | width="10%" align="center" style="border-top: 2px solid #000;" | [[File:Fc9-void-icon.png]] - VOID
| |
| | width="90%" style="border-top: 2px solid #000;" | ''Return''
| |
| |}
| |
|
| |
|
|
| |
|
| {| class="wikitable" style="width:60%; background-color:#FFFFFF;"
| |
| |-
| |
| | width="10%" align="center" style="background-color:#D8C9D8;" align="center" | [[File:Fc9-comp-macro.png]]
| |
| | width="90%" style="background-color:#D8C9D8; color:#4B008D;" | '''AddPoint'''
| |
| |-
| |
| | colspan="2" | Adds a new data point to the graph.
| |
| |-
| |
| |-
| |
| | width="10%" align="center" | [[File:]] -
| |
| | width="90%" | Data
| |
| |-
| |
| | colspan="2" | Data Value to plot
| |
| |-
| |
| | width="10%" align="center" | [[File:Fc9-u8-icon.png]] - BYTE
| |
| | width="90%" | Index
| |
| |-
| |
| | colspan="2" | Plot Index: Range 0-7
| |
| |-
| |
| | width="10%" align="center" style="border-top: 2px solid #000;" | [[File:Fc9-void-icon.png]] - VOID
| |
| | width="90%" style="border-top: 2px solid #000;" | ''Return''
| |
| |}
| |
|
| |
|
|
| |
|
| {| class="wikitable" style="width:60%; background-color:#FFFFFF;"
| |
| |-
| |
| | width="10%" align="center" style="background-color:#D8C9D8;" align="center" | [[File:Fc9-comp-macro.png]]
| |
| | width="90%" style="background-color:#D8C9D8; color:#4B008D;" | '''Initialise'''
| |
| |-
| |
| | colspan="2" | Initialises the graph object on the GLCD to the specified dimensions.
| |
| |-
| |
| |-
| |
| | width="10%" align="center" style="border-top: 2px solid #000;" | [[File:Fc9-void-icon.png]] - VOID
| |
| | width="90%" style="border-top: 2px solid #000;" | ''Return''
| |
| |}
| |
|
| |
|
|
| |
|
| {| class="wikitable" style="width:60%; background-color:#FFFFFF;"
| |
| |-
| |
| | width="10%" align="center" style="background-color:#D8C9D8;" align="center" | [[File:Fc9-comp-macro.png]]
| |
| | width="90%" style="background-color:#D8C9D8; color:#4B008D;" | '''ReadFontStat'''
| |
| |-
| |
| | colspan="2" |
| |
| |-
| |
| |-
| |
| | width="10%" align="center" | [[File:Fc9-u8-icon.png]] - BYTE
| |
| | width="90%" | Font
| |
| |-
| |
| | colspan="2" |
| |
| |-
| |
| | width="10%" align="center" | [[File:Fc9-u8-icon.png]] - BYTE
| |
| | width="90%" | Index
| |
| |-
| |
| | colspan="2" |
| |
| |-
| |
| | width="10%" align="center" style="border-top: 2px solid #000;" | [[File:Fc9-u8-icon.png]] - BYTE
| |
| | width="90%" style="border-top: 2px solid #000;" | ''Return''
| |
| |}
| |
|
| |
|
|
| |
|
| {| class="wikitable" style="width:60%; background-color:#FFFFFF;"
| |
| |-
| |
| | width="10%" align="center" style="background-color:#D8C9D8;" align="center" | [[File:Fc9-comp-macro.png]]
| |
| | width="90%" style="background-color:#D8C9D8; color:#4B008D;" | '''Print'''
| |
| |-
| |
| | colspan="2" |
| |
| |-
| |
| |-
| |
| | width="10%" align="center" | [[File:Fc9-string-icon.png]] - STRING
| |
| | width="90%" | Str
| |
| |-
| |
| | colspan="2" |
| |
| |-
| |
| | width="10%" align="center" | [[File:Fc9-u16-icon.png]] - UINT
| |
| | width="90%" | X1
| |
| |-
| |
| | colspan="2" |
| |
| |-
| |
| | width="10%" align="center" | [[File:Fc9-u16-icon.png]] - UINT
| |
| | width="90%" | Y1
| |
| |-
| |
| | colspan="2" |
| |
| |-
| |
| | width="10%" align="center" | [[File:Fc9-u8-icon.png]] - BYTE
| |
| | width="90%" | Font
| |
| |-
| |
| | colspan="2" |
| |
| |-
| |
| | width="10%" align="center" | [[File:Fc9-u8-icon.png]] - BYTE
| |
| | width="90%" | Transparent
| |
| |-
| |
| | colspan="2" |
| |
| |-
| |
| | width="10%" align="center" style="border-top: 2px solid #000;" | [[File:Fc9-void-icon.png]] - VOID
| |
| | width="90%" style="border-top: 2px solid #000;" | ''Return''
| |
| |}
| |
|
| |
|
| | ==Macro reference== |
|
| |
|
| {| class="wikitable" style="width:60%; background-color:#FFFFFF;" | | ===AddPoint=== |
| | {| class="mtx-class-macrotable wikitable" |
| |- | | |- |
| | width="10%" align="center" style="background-color:#D8C9D8;" align="center" | [[File:Fc9-comp-macro.png]] | | | width="10%" align="center" class="mtx-class-macrohead" | [[File:Fc9-comp-macro.png]] |
| | width="90%" style="background-color:#D8C9D8; color:#4B008D;" | '''SetBackgroundColour''' | | | width="90%" class="mtx-class-macrohead" | '''AddPoint''' |
| |- | | |- |
| | colspan="2" | | | | colspan="2" | Adds a new data point to the graph. |
| |- | | |- |
| |- | | |- |
| | width="10%" align="center" | [[File:Fc9-u8-icon.png]] - BYTE | | | width="10%" align="center" | [[File:Fc9-s16-icon.png]] - INT |
| | width="90%" | Pixel_Colour | | | width="90%" | Data |
| |-
| |
| | colspan="2" |
| |
| |-
| |
| | width="10%" align="center" style="border-top: 2px solid #000;" | [[File:Fc9-void-icon.png]] - VOID
| |
| | width="90%" style="border-top: 2px solid #000;" | ''Return''
| |
| |}
| |
| | |
| | |
| {| class="wikitable" style="width:60%; background-color:#FFFFFF;"
| |
| |-
| |
| | width="10%" align="center" style="background-color:#D8C9D8;" align="center" | [[File:Fc9-comp-macro.png]]
| |
| | width="90%" style="background-color:#D8C9D8; color:#4B008D;" | '''SetForegroundColour'''
| |
| |-
| |
| | colspan="2" |
| |
| |- | | |- |
| | | colspan="2" | Data Value to plot |
| |- | | |- |
| | width="10%" align="center" | [[File:Fc9-u8-icon.png]] - BYTE | | | width="10%" align="center" | [[File:Fc9-u8-icon.png]] - BYTE |
| | width="90%" | Pixel_Colour | | | width="90%" | Index |
| |- | | |- |
| | colspan="2" | | | | colspan="2" | Plot Index: Range 0-7 |
| |- | | |- |
| | width="10%" align="center" style="border-top: 2px solid #000;" | [[File:Fc9-void-icon.png]] - VOID | | | width="10%" align="center" style="border-top: 2px solid #000;" | [[File:Fc9-void-icon.png]] - VOID |
| Line 205: |
Line 127: |
|
| |
|
|
| |
|
| {| class="wikitable" style="width:60%; background-color:#FFFFFF;" | | ===Initialise=== |
| | {| class="mtx-class-macrotable wikitable" |
| |- | | |- |
| | width="10%" align="center" style="background-color:#D8C9D8;" align="center" | [[File:Fc9-comp-macro.png]] | | | width="10%" align="center" class="mtx-class-macrohead" | [[File:Fc9-comp-macro.png]] |
| | width="90%" style="background-color:#D8C9D8; color:#4B008D;" | '''DrawRectangle''' | | | width="90%" class="mtx-class-macrohead" | '''Initialise''' |
| |- | | |- |
| | colspan="2" | | | | colspan="2" | Initialises the graph object on the GLCD to the specified dimensions. |
| |-
| |
| |-
| |
| | width="10%" align="center" | [[File:Fc9-u16-icon.png]] - UINT
| |
| | width="90%" | X1
| |
| |-
| |
| | colspan="2" |
| |
| |-
| |
| | width="10%" align="center" | [[File:Fc9-u16-icon.png]] - UINT
| |
| | width="90%" | Y1
| |
| |-
| |
| | colspan="2" |
| |
| |-
| |
| | width="10%" align="center" | [[File:Fc9-u16-icon.png]] - UINT
| |
| | width="90%" | X2
| |
| |-
| |
| | colspan="2" |
| |
| |-
| |
| | width="10%" align="center" | [[File:Fc9-u16-icon.png]] - UINT
| |
| | width="90%" | Y2
| |
| |-
| |
| | colspan="2" |
| |
| |-
| |
| | width="10%" align="center" | [[File:Fc9-u8-icon.png]] - BYTE
| |
| | width="90%" | Transparent
| |
| |-
| |
| | colspan="2" |
| |
| |-
| |
| | width="10%" align="center" | [[File:Fc9-u8-icon.png]] - BYTE
| |
| | width="90%" | Solid
| |
| |- | | |- |
| | colspan="2" |
| |
| |- | | |- |
| | width="10%" align="center" style="border-top: 2px solid #000;" | [[File:Fc9-void-icon.png]] - VOID | | | width="10%" align="center" style="border-top: 2px solid #000;" | [[File:Fc9-void-icon.png]] - VOID |
| Line 248: |
Line 141: |
|
| |
|
|
| |
|
| {| class="wikitable" style="width:60%; background-color:#FFFFFF;"
| | ==Property reference== |
| |-
| |
| | width="10%" align="center" style="background-color:#D8C9D8;" align="center" | [[File:Fc9-comp-macro.png]]
| |
| | width="90%" style="background-color:#D8C9D8; color:#4B008D;" | '''SetBackgroundColour'''
| |
| |-
| |
| | colspan="2" |
| |
| |-
| |
| |-
| |
| | width="10%" align="center" | [[File:Fc9-u8-icon.png]] - BYTE
| |
| | width="90%" | Red
| |
| |-
| |
| | colspan="2" |
| |
| |-
| |
| | width="10%" align="center" | [[File:Fc9-u8-icon.png]] - BYTE
| |
| | width="90%" | Green
| |
| |-
| |
| | colspan="2" |
| |
| |-
| |
| | width="10%" align="center" | [[File:Fc9-u8-icon.png]] - BYTE
| |
| | width="90%" | Blue
| |
| |-
| |
| | colspan="2" |
| |
| |-
| |
| | width="10%" align="center" style="border-top: 2px solid #000;" | [[File:Fc9-void-icon.png]] - VOID
| |
| | width="90%" style="border-top: 2px solid #000;" | ''Return''
| |
| |}
| |
| | |
|
| |
|
| {| class="wikitable" style="width:60%; background-color:#FFFFFF;" | | {| class="mtx-class-macrotable wikitable" |
| |- | | |- |
| | width="10%" align="center" style="background-color:#D8C9D8;" align="center" | [[File:Fc9-comp-macro.png]] | | | width="10%" align="center" class="mtx-class-macrohead" | [[File:Fc9-prop-icon.png]] |
| | width="90%" style="background-color:#D8C9D8; color:#4B008D;" | '''SetForegroundColour''' | | | width="90%" class="mtx-class-macrohead" | '''Properties''' |
| |- | | |- |
| | colspan="2" |
| |
| |- | | |- |
| | | width="10%" align="center" class="mtx-class-propfolder" | [[File:Fc9-conn-icon.png]] |
| | | width="90%" class="mtx-class-propfolder" | Display Properties |
| |- | | |- |
| | width="10%" align="center" | [[File:Fc9-u8-icon.png]] - BYTE
| |
| | width="90%" | Red
| |
| |- | | |- |
| | colspan="2" |
| | | width="10%" align="center" | [[File:Fc9-type-16-icon.png]] |
| |-
| | | width="90%" | LinkTo |
| | width="10%" align="center" | [[File:Fc9-u8-icon.png]] - BYTE
| |
| | width="90%" | Green
| |
| |-
| |
| | colspan="2" |
| |
| |-
| |
| | width="10%" align="center" | [[File:Fc9-u8-icon.png]] - BYTE
| |
| | width="90%" | Blue
| |
| |-
| |
| | colspan="2" |
| |
| |-
| |
| | width="10%" align="center" style="border-top: 2px solid #000;" | [[File:Fc9-void-icon.png]] - VOID
| |
| | width="90%" style="border-top: 2px solid #000;" | ''Return''
| |
| |}
| |
| | |
| | |
| {| class="wikitable" style="width:60%; background-color:#FFFFFF;"
| |
| |-
| |
| | width="10%" align="center" style="background-color:#D8C9D8;" align="center" | [[File:Fc9-comp-macro.png]]
| |
| | width="90%" style="background-color:#D8C9D8; color:#4B008D;" | '''DrawRectangle'''
| |
| |-
| |
| | colspan="2" |
| |
| |-
| |
| |-
| |
| | width="10%" align="center" | [[File:Fc9-u16-icon.png]] - UINT
| |
| | width="90%" | X1
| |
| |-
| |
| | colspan="2" |
| |
| |-
| |
| | width="10%" align="center" | [[File:Fc9-u16-icon.png]] - UINT
| |
| | width="90%" | Y1
| |
| |-
| |
| | colspan="2" |
| |
| |-
| |
| | width="10%" align="center" | [[File:Fc9-u16-icon.png]] - UINT
| |
| | width="90%" | X2
| |
| |-
| |
| | colspan="2" |
| |
| |-
| |
| | width="10%" align="center" | [[File:Fc9-u16-icon.png]] - UINT
| |
| | width="90%" | Y2
| |
| |-
| |
| | colspan="2" |
| |
| |-
| |
| | width="10%" align="center" | [[File:Fc9-u8-icon.png]] - BYTE
| |
| | width="90%" | Transparent
| |
| |-
| |
| | colspan="2" |
| |
| |-
| |
| | width="10%" align="center" | [[File:Fc9-u8-icon.png]] - BYTE
| |
| | width="90%" | Solid
| |
| |-
| |
| | colspan="2" |
| |
| |-
| |
| | width="10%" align="center" style="border-top: 2px solid #000;" | [[File:Fc9-void-icon.png]] - VOID
| |
| | width="90%" style="border-top: 2px solid #000;" | ''Return''
| |
| |}
| |
| | |
| | |
| | |
| | |
| ==Property reference==
| |
| | |
| {| class="wikitable" style="width:60%; background-color:#FFFFFF;"
| |
| |-
| |
| | width="10%" align="center" style="background-color:#D8C9D8;" | [[File:Fc9-prop-icon.png]]
| |
| | width="90%" style="background-color:#D8C9D8; color:#4B008D;" | '''Properties'''
| |
| |-
| |
| |-
| |
| | width="10%" align="center" | [[File:Fc9-type-17-icon.png]] | |
| | width="90%" | gLCD Object | |
| |- | | |- |
| | colspan="2" | Graphical LCD Object to draw the graph on | | | colspan="2" | Graphical LCD Object to draw the graph on |
| Line 386: |
Line 182: |
| |- | | |- |
| | colspan="2" | Vertical size of the graph in pixels | | | colspan="2" | Vertical size of the graph in pixels |
| | |- |
| | | width="10%" align="center" class="mtx-class-propfolder" | [[File:Fc9-conn-icon.png]] |
| | | width="90%" class="mtx-class-propfolder" | Graph Properties |
| | |- |
| |- | | |- |
| | width="10%" align="center" | [[File:Fc9-type-16-icon.png]] | | | width="10%" align="center" | [[File:Fc9-type-16-icon.png]] |
| Line 426: |
Line 226: |
| |- | | |- |
| | colspan="2" | Decides if a X or Y grid is shown for the graph | | | colspan="2" | Decides if a X or Y grid is shown for the graph |
| | |- |
| | | width="10%" align="center" class="mtx-class-propfolder" | [[File:Fc9-conn-icon.png]] |
| | | width="90%" class="mtx-class-propfolder" | Theme |
| | |- |
| |- | | |- |
| | width="10%" align="center" | [[File:Fc9-type-1-icon.png]] | | | width="10%" align="center" | [[File:Fc9-type-1-icon.png]] |
| Line 436: |
Line 240: |
| |- | | |- |
| | colspan="2" | Determines the graph plot colour. | | | colspan="2" | Determines the graph plot colour. |
| |-
| |
| | width="10%" align="center" style="background-color:#D8C9D8;" | [[File:Fc9-conn-icon.png]]
| |
| | width="90%" style="background-color:#D8C9D8; color:#4B008D;" | '''Connections'''
| |
| |-
| |
| |-
| |
| | width="10%" align="center" style="background-color:#D8C9D8;" | [[File:Fc9-conn-icon.png]]
| |
| | width="90%" style="background-color:#D8C9D8; color:#4B008D;" | '''Simulations'''
| |
| |-
| |
| |} | | |} |
| | |
| | ==Component Source Code== |
| | |
| | Please click here to download the component source project: [https://www.flowcode.co.uk/wiki/componentsource/FC_Comp_Source_Lib_GLCD_Graph.fcfx FC_Comp_Source_Lib_GLCD_Graph.fcfx] |
| | |
| | Please click here to view the component source code (Beta): [https://www.flowcode.co.uk/FlowchartView/?wfile=componentsource/FC_Comp_Source_Lib_GLCD_Graph.fcfx FC_Comp_Source_Lib_GLCD_Graph.fcfx] |
| Author
|
Matrix TSL
|
| Version
|
1.2
|
| Category
|
Graphical Library
|
GLCD Graph Creator component
A component to simplify the process of drawing graphs and charts using a graphical LCD.
Detailed description
No detailed description exists yet for this component
Examples
The graph creator component must be linked to the graphical LCD using the gLCD Object property.
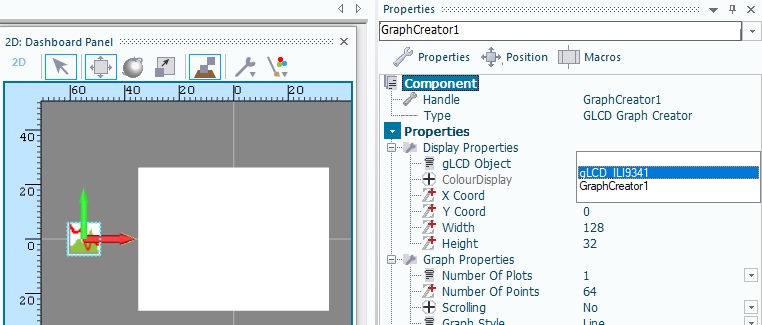
The X Coord, Y Coord, Width and Height component properties set the size and position of the graph on the gLCD.
In the attached example the ADC component sets the input to the graph. Every 50ms a sample is taken and added to the graph.
 Graph Creator Demo
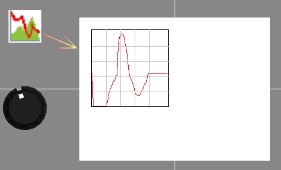
Any size of graph can be created. For efficiency it is best to try and stick to the following rules.
- The width should be equal to or a multiple of the number of points
- The height should be equal to or a division of the input range - Min Value 0 to Max Value 255 = input range of 256
- If Show Border is enabled then Width and Height should be as above plus 2 to account for the border pixels
Macro reference
AddPoint

|
AddPoint
|
| Adds a new data point to the graph.
|
 - INT - INT
|
Data
|
| Data Value to plot
|
 - BYTE - BYTE
|
Index
|
| Plot Index: Range 0-7
|
 - VOID - VOID
|
Return
|
Initialise
|
|
Initialise
|
| Initialises the graph object on the GLCD to the specified dimensions.
|
| - VOID
|
Return
|
Property reference

|
Properties
|

|
Display Properties
|

|
LinkTo
|
| Graphical LCD Object to draw the graph on
|

|
ColourDisplay
|
| Automatically detects if the graphical LCD object is colour or monochrome
|

|
X Coord
|
| X coordinate for the top left of the graph container rectangle
|
|
|
Y Coord
|
| Y coordinate for the top left of the graph container rectangle
|
|
|
Width
|
| Horizontal size of the graph in pixels
|
|
|
Height
|
| Vertical size of the graph in pixels
|
|
|
Graph Properties
|
|
|
Number Of Plots
|
| Determines the number of plots that can be displayed simultaneously on the graph. Monochrome displays can only support a single plot.
|
|
|
Number Of Points
|
| Number of data points the graph can store, multiplied by the number of plots.
|
|
|
Scrolling
|
| Controls how data is drawn onto the display. Scrolling is useful for slower data where you want a constant plot with the right hand side always being the latest data. None scrolling is useful for faster data such as audio snippets.
|
|
|
Graph Style
|
| Controls the graph draw style. Point - Draws a single point Line - Draws a line from the last point to the new point
|

|
Min Value
|
| Value to represent the bottom Y axis on the graph
|
|
|
Max Value
|
| Value to represent the top Y axis on the graph
|
|
|
Show Border
|
| Decides if a border for the graph is generated
|
|
|
Show Grid
|
| Decides if a X or Y grid is shown for the graph
|
|
|
Theme
|

|
Background Colour
|
| Determines the graph background colour.
|
|
|
Plot 0 Colour
|
| Determines the graph plot colour.
|
Component Source Code
Please click here to download the component source project: FC_Comp_Source_Lib_GLCD_Graph.fcfx
Please click here to view the component source code (Beta): FC_Comp_Source_Lib_GLCD_Graph.fcfx


 - INT
- INT
 - BYTE
 - VOID


